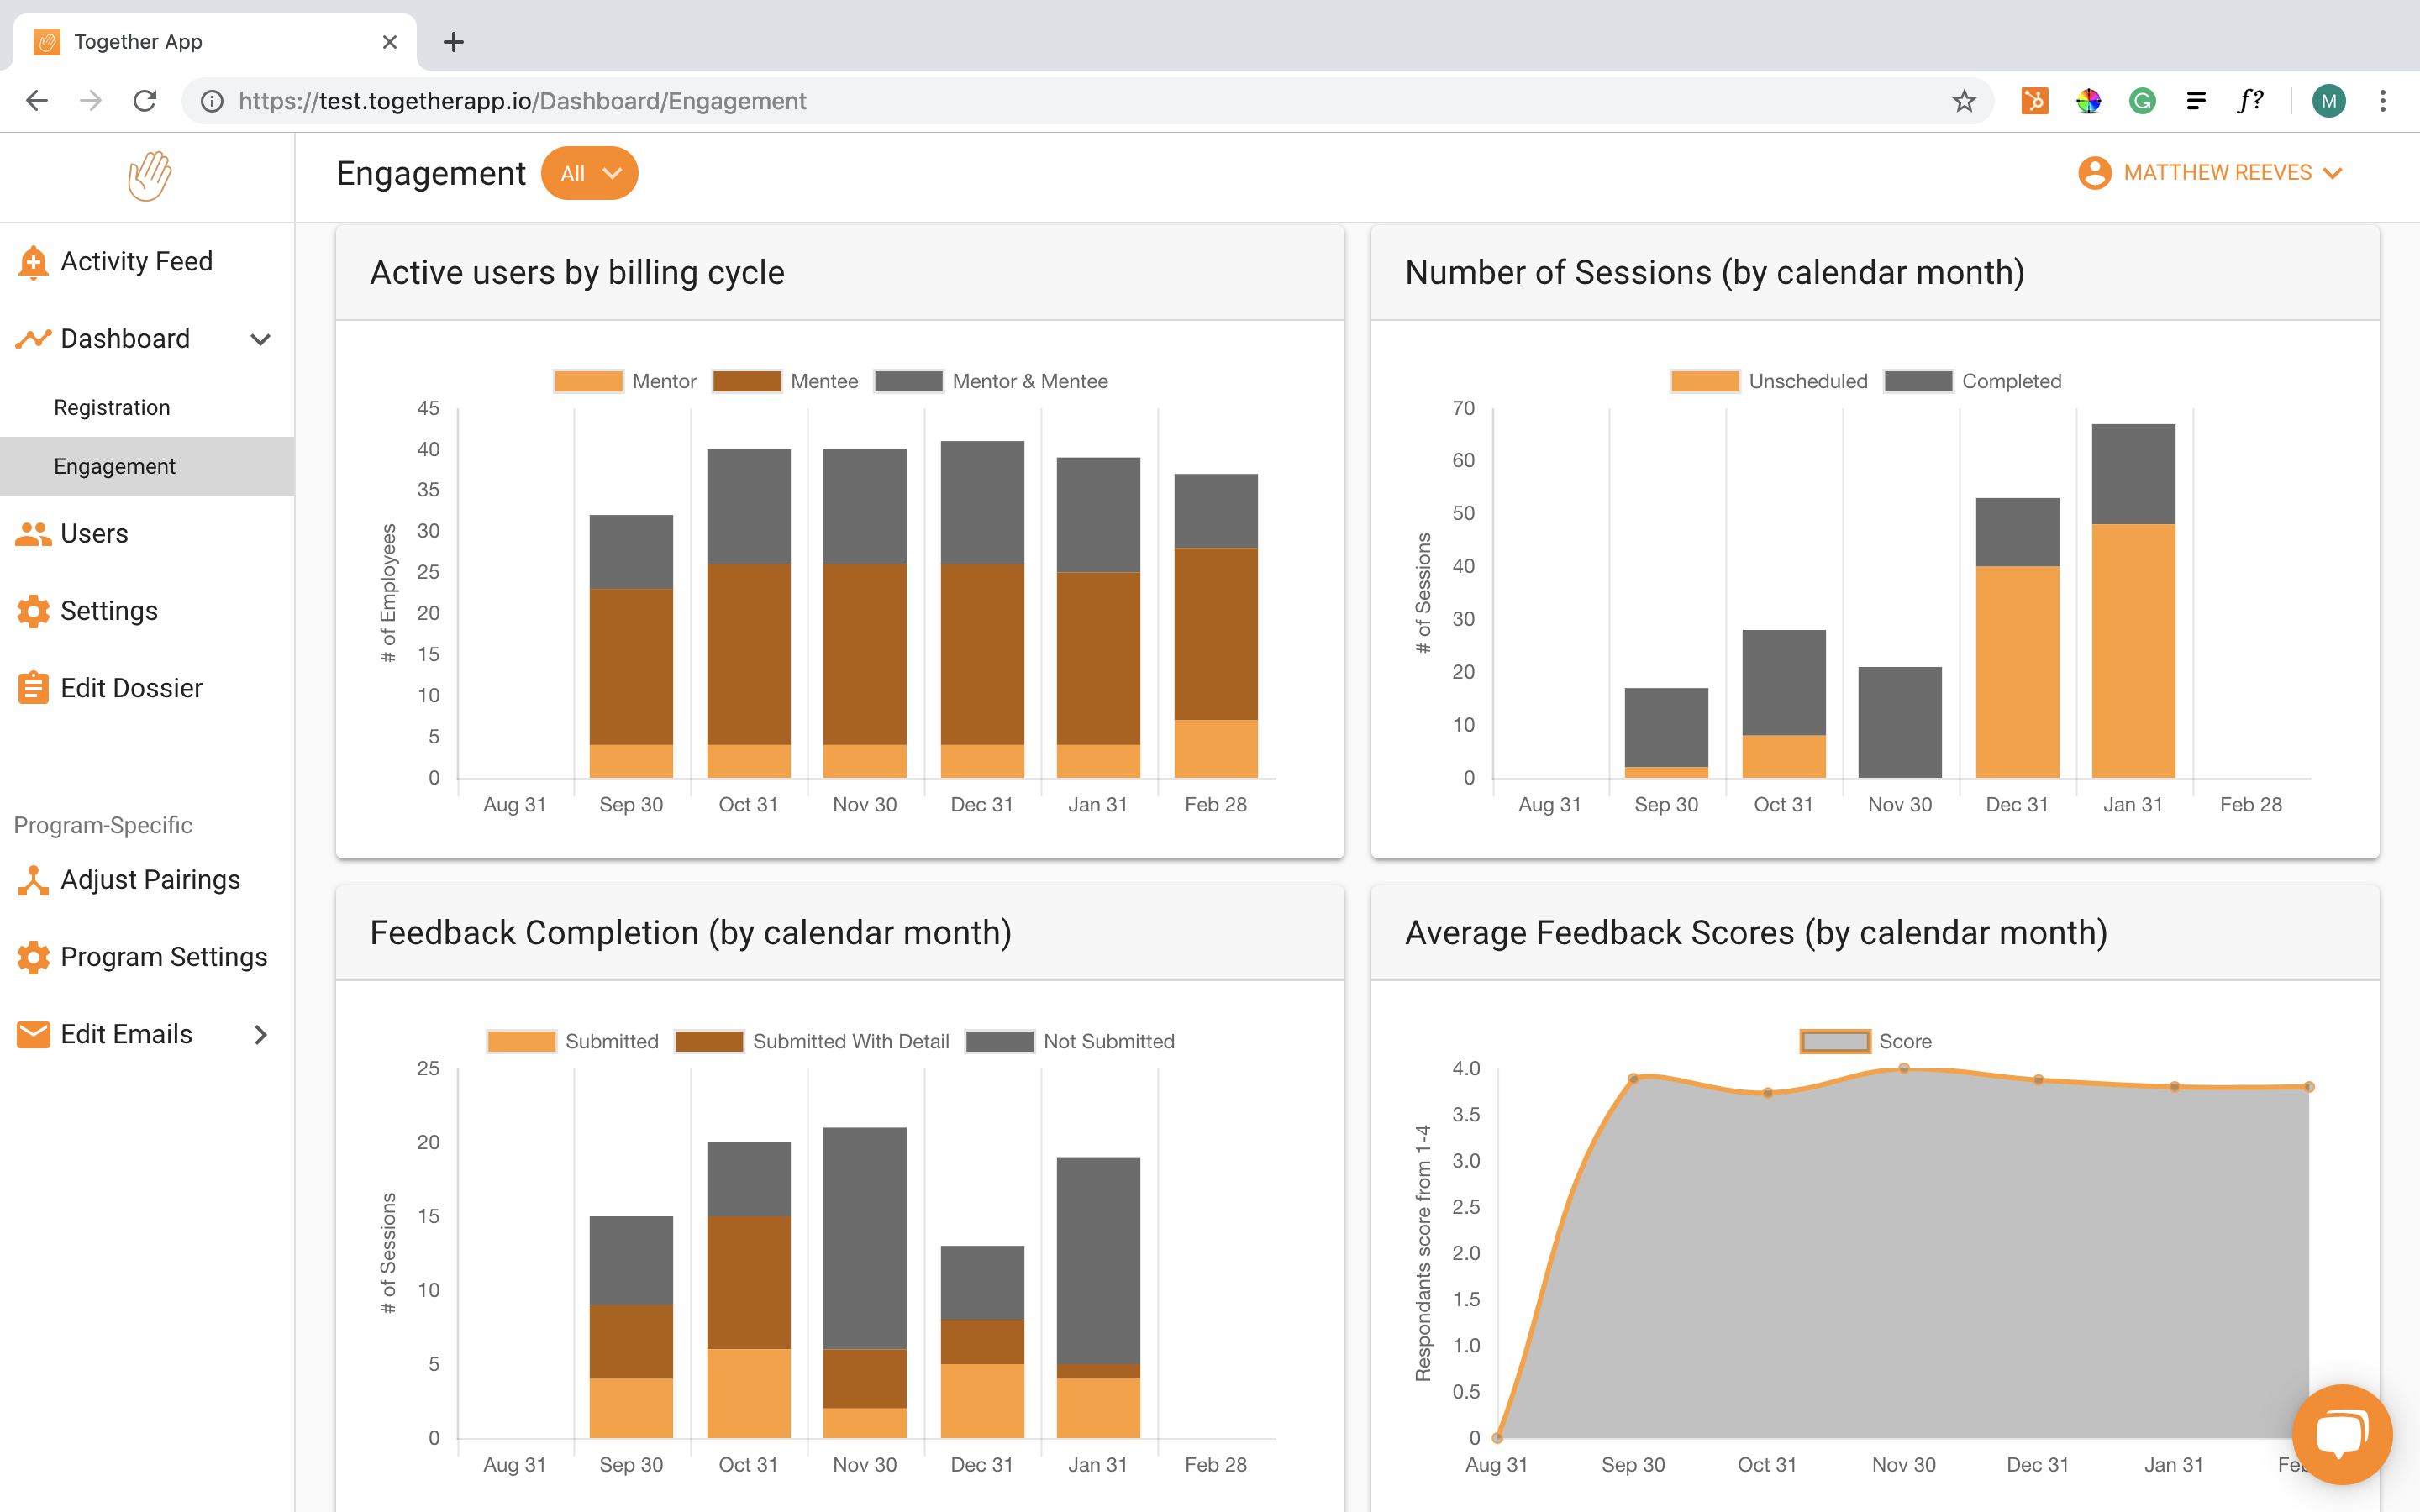
You can monitor your program at a macro level from the engagement dashboard. To access the engagement dashboard click “Dashboard” in the left hand panel in the administrator portal. From the expanded menu, click “engagement”.
On the engagement dashboard, you will see multiple graphs that present various metrics about your program over time. By default you will see the following graphs:
- Active users: this graph indicates how many users are counted as active in each month
- Number of sessions: this graph indicates the total number of sessions that the platform has assigned to mentors and mentees. Each period is further broken down so that you can see how many sessions that were assigned have been scheduled or completed.
- Feedback completion: this graph indicates what percentage of feedback was completed for the sessions assigned by the platform. Feedback can be either submitted (a user solely clicked on the rating in the followup email) or submitted with detail (a user clicked on the feedback in the email and provided additional information in the browser-based form)
- Feedback score: this graph indicates the average score of mentorship sessions on a 1 - 4 scale. This score is collected from mentees after each session